Chapter 8 Generic data workflow
In a very generic, all empirical analysis goes through the following steps:
- acquiring data (primary or secondary)
- cleaning data (reformatting, standardizing, dropping) to create analysis data
- analyzing data and reporting results in tables, figures, and in-text numbers.
8.1 Details on data workflows
In a reproducible workflow, instructions to perform all of the above are provided. Most of the time, those instructions will be computer code, to be interpreted using statistical software, in some cases to be compiled into executables (C++, Fortran). Sometimes, the data acquisition might also be coded - using software packages or scripts to download, or through computer-assisted surveys or experiments. But more often, acquiring data entails manual actions. For instance, secondary data access might be described in Data Availability Statements, whereas primary data acquisition might be described in survey documentation, field guides, and in experiment instructions.2 Once analysis data is created, the analysis programs generate output that is then embedded in the article. Often, that output might be ready-made tables and figures. But sometimes authors will manually transcode output from log files into tables. Modern reproducible documents will capture such output and embed it into a document directly.
The following diagram illustrates the generic flow:
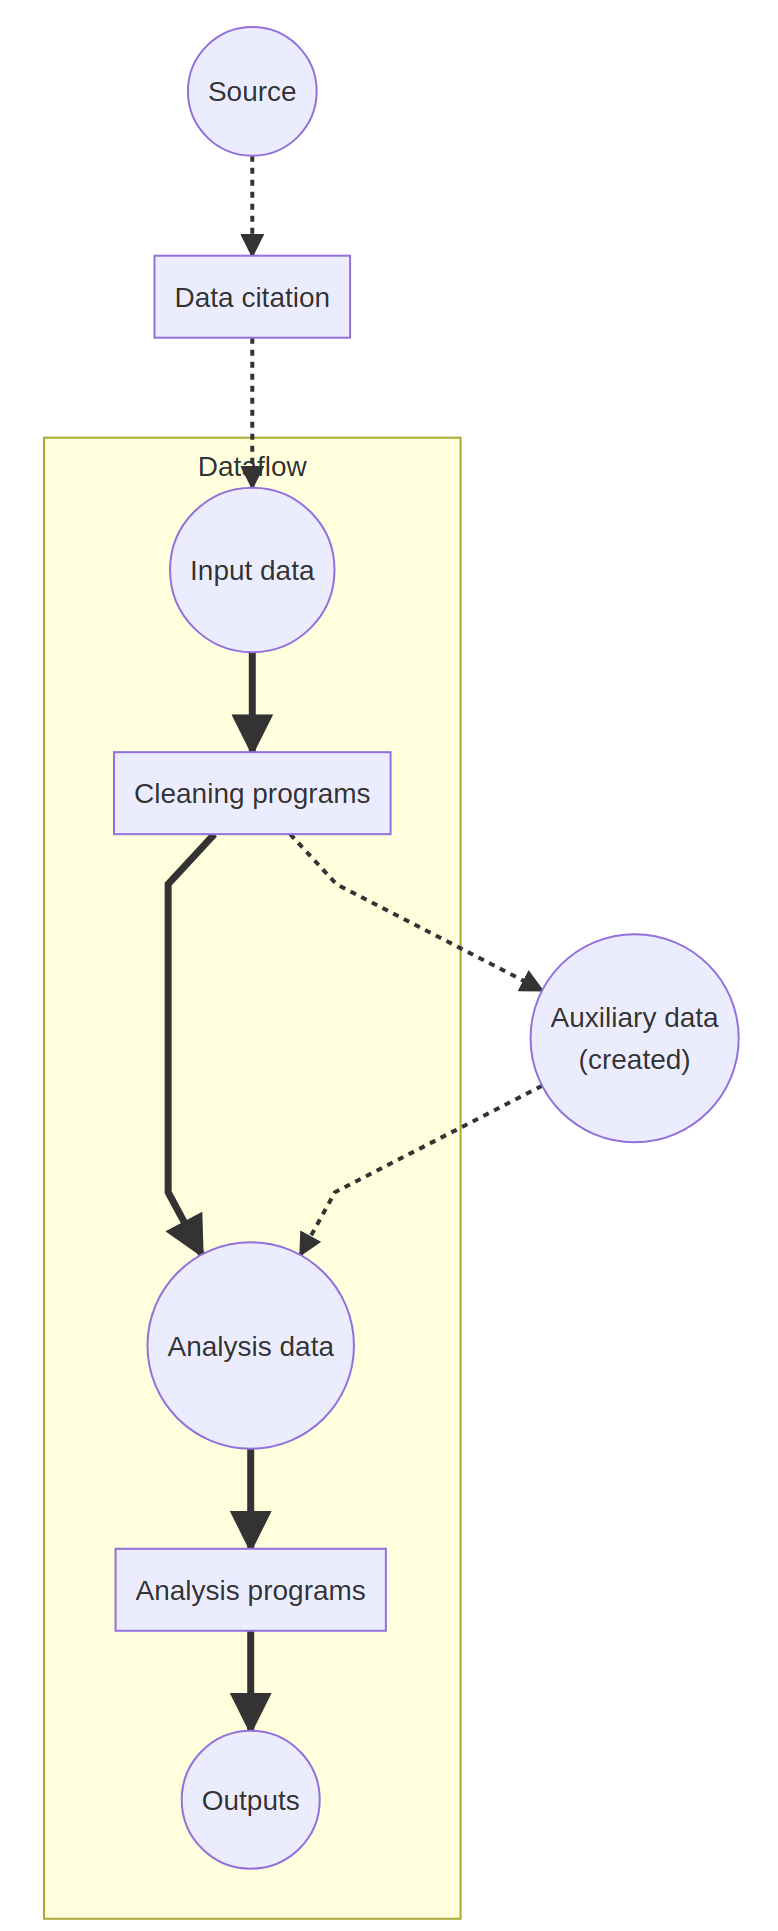
Real articles are often more complex. A simple example will be discussed next.
8.2 A simple example
At the Github repository labordynamicsinstitute/simple-example, we have prepared a very simple example of a data analysis workflow. It illustrates the concepts above.
Read the README before going on.
We focus on the information provided in the README first:
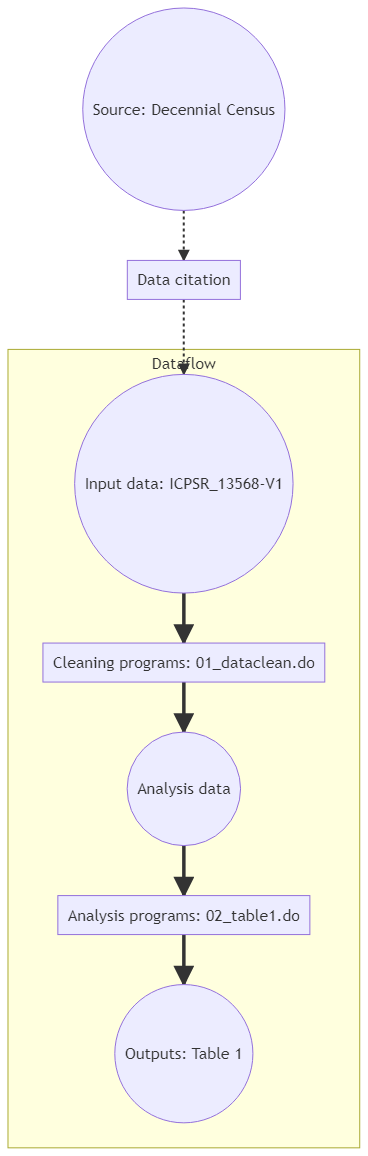
Source: Census of Population and Housing, 2000
The source data is identified, and a data citation is provided as part of the README. The README notes that the data is considered public-use, but a login is required at ICPSR, which is the distributor of the data. The data acquisition, as described, is a manual process (because it requires a login). The data is also manually unzipped, and the final location described.
Note: this could be scripted to make part of the data acquisition code-driven.
Cleaning programs:01_dataclean.do
A cleaning program is identified and described.
Analysis data: is verbally described in the README (“clean merged dataset”)
Note: Could this be improved?
Analysis program:02_table1.doOutputs: Table 1
An analysis program is also listed, and identified as creating output Table 1. An inspection of the “manuscript” shows that only a single table is included.
So a flow diagram for the simple example might be:
Note that when the authors generate or collect primary data, subsequent users of the same data are secondary data users, but replication might also involve re-executing the experiment, or collecting data anew with the same survey instruments.↩︎