Consumer expectations around COVID-19: Evolution over time
Fabian Lange, Lars Vilhuber
2020-06-01
A PDF version of this document is available.
Summary
Since Apr 24, 2020, we have been collecting direct information on consumers’ expectations about the duration of social distancing rules, including stay-at-home and social-distancing rules, and of business closures, in the United States and Canada. The latest estimate of the median expectation for the duration of restrictions on business closures in the US stands at 32 days, corresponding to June 26. In Canada, the equivalent number is 43 days (representing a median expected end date of July 07). In both countries, the expected duration is declining. Uncertainty (dispersion) remains high, and increasing. The latest estimates of the median expectation for the duration of social distancing rules are increasing in both countries: 65 days (corresponding to an end date of July 29) in the United States, and 92 days (August 25) in Canada. Uncertainty in both countries is very high and increasing, with substantial fractions of respondents in both countries expecting social distancing to persist beyond 6 months.
Background
The COVID-19 health crisis is cause for much uncertainty among consumers, businesses, and policy-makers. Business uncertainty has gone up (Scott R Baker et al. 2020), household spending patterns are changing (Scott R. Baker et al. 2020),1 and household uncertainty about how to spend and save is going up2. Substantial disagreement remains about when the right time for opening back up may be (Pew Research Center, May 7, 2020). As economic actors and policy-makers move forward in unfreezing the economy, forecasting future consumer and business behavior, and uncertainty surrounding such behavior, remains critical. Timeliness is an issue. Scott R Baker et al. (2020) use stock market volatility measures, newspaper-based measures of economic uncertainty (Baker, Bloom, and Davis 2016; Scott R. Baker, Bloom, and Davis 2020), and dispersion of survey responses about perceived business-level uncertainty (“Survey of Business Uncertainty” n.d.; Altig et al. 2019).
Since Apr 24, 2020, we have been collecting direct information on consumers’ expectations. Each week, we have been asking Americans and Canadians when they expect social distancing rules, including stay-at-home and social-distancing rules, and business closures, to end.3 We estimate the median expectation, and compute two measures of uncertainty.
Expectations for duration of restrictions in the United States
The median expectation for the duration of restrictions on business closures is declining (see Figure, left panel), from 40 days in week 1 to now 32 days. However, despite many states re-opening, the expectation seems to decline less than one would expect given the elapsed calendar time: the estimated median end date for business closures has shifted from June 06 in week 1 to now June 26. Uncertainty remains high and is increasing. In the latest survey round, the estimated interquartile range (IQR) of expectations – identified on the Figure by the shaded area – is 49, compared to 38 in the first week.
This is even more true of expectations for the duration of social distancing restrictions. Both the expected duration as well as the estimated dispersion are trending upwards. In the latest round, the estimated median expectation stands at 65 days (corresponding to an end date of July 29), and the estimated IQR is 125. This compares to an estimated expectation of 51 days (June 18) and an estimated IQR of 62 in the first round.
Figure: Evolution of expectations in the United States
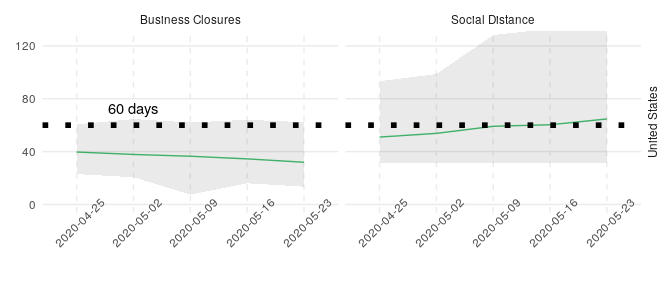
Note: Based on fitting a mixture of log normal random variables to answers from the Expectation Survey. Dates indicate the start of the week in which the survey questions were fielded. Shaded areas represent the interquartile range of estimated expectations. The figure has been truncated vertically - for details on the 75th percentile, see the Data tab.
Data
Expectations for duration of restrictions in Canada
The median expectation for the duration of restrictions on business closures is declining in Canada as well (see Figure, left top panel), from 55 days in week 1 to now 43 days. The expected duration remains higher than in the US, and declining slower, both in Québec – the COVID-19 hotspot in Canada – and in Canada overall. As provinces tentatively re-open in various ways, the estimated median end date for business closures is slipping from June 21 in week 1 to now July 07. Uncertainty remains high (higher, in fact, than in the US), and is increasing. In the latest survey round, the estimated interquartile range (IQR) of expectations – identified on the Figure by the shaded area – is 61, compared to 53 in the first week.
For Québec, the numbers for business closures are broadly similar to the rest of Canada. The median estimated expected duration in the latest round is 40 days (median end date for business closures July 04). The estimated interquartile range (IQR) of expectations is 75, somewhat higher than in the rest of Canada, in particular given the stark differences between Montreal and the rest of the province.
Expectations for the duration of social distancing restrictions are trending similarly to the United States, but from a higher level, and with substantially higher uncertainty, both in Canada overall, and very strongly in Québec. Both the expected duration as well as the estimated dispersion are trending upwards. In the latest round, the estimated median expectation stands at 92 days in Canada overall and 104 days in Québec (corresponding to end dates of August 25 and September 06, respectively), about a month longer than the United States in both cases (27 and 39 days, respectively). The estimated IQR is 220 in Canada, and 285 in Québec - about 1.8 and 2.3 times higher than in the US. At the 75th percentile, numbers for both Canada and Québec have stayed substantially beyond 125 days: 272 and 350 days, respectively!
Figure: Evolution of expectations in Canada
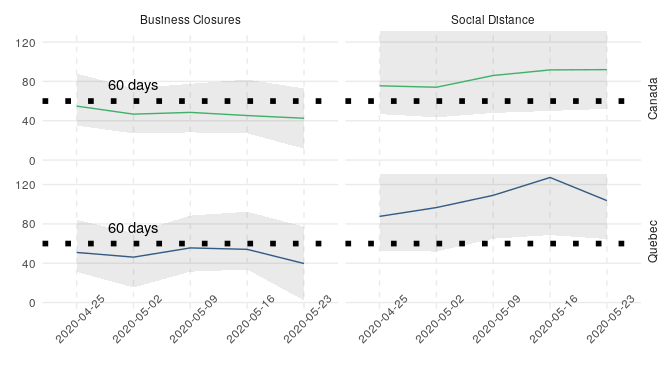
Note: Based on fitting a mixture of log normal random variables to answers from the Expectation Survey. Dates indicate the start of the week in which the survey questions were fielded. Shaded areas represent the interquartile range of estimated expectations. The figure has been truncated vertically - for details on the 75th percentile, see the Data tab.
Data
References
Altig, David, Jose Maria Barrero, Nicholas Bloom, Steven Davis, Brent Meyer, and Nicholas Parker. 2019. “Surveying Business Uncertainty.” w25956. Cambridge, MA: National Bureau of Economic Research. https://doi.org/10.3386/w25956.
Baker, Scott R., Nicholas Bloom, and Steven J. Davis. 2016. “Measuring Economic Policy Uncertainty.” The Quarterly Journal of Economics 131 (4): 1593–1636. https://doi.org/10.1093/qje/qjw024.
———. 2020. “Economic Policy Uncertainty Index.” The Quarterly Journal of Economics. https://www.policyuncertainty.com/us_monthly.html.
Baker, Scott R, Nicholas Bloom, Steven J Davis, and Stephen J Terry. 2020. “COVID-Induced Economic Uncertainty.” Working Paper 26983. National Bureau of Economic Research. https://doi.org/10.3386/w26983.
Baker, Scott R., RA Farrokhnia, Steffen Meyer, Michaela Pagel, and Constantine Yannelis. 2020. “Corona_Stimulus.pdf.” Mimeo. University of Chicago. https://drive.google.com/file/u/1/d/19KaPY-xV27feRZF74EBby3DZ3RW9K3Bp/view?usp=drive_open&usp=embed_facebook.
Scott R. Baker et al. (2020) observe reductions in spending on durables and increases on food, and attribute it to the impact of stay-at-home rules and supply disruptions.↩
https://www.newyorkfed.org/newsevents/news/research/2020/20200511↩
For more details, see our detailed methodology for this post. Respondent data can be downloaded at https://labordynamicsinstitute.github.io/covid19-expectations-data/.↩