Consumer expectations around COVID-19: Results for Week 2
Fabian Lange, Lars Vilhuber
2020-05-13
Introduction
During the COVID-19 health crisis, policy-makers need to know how consumers and businesses will make decisions. Uncertainty about the future is part of the decision-making process, and the current crisis has changed many expectations. Laid-off workers must decide when they are expected to return to jobs, which, hopefully, only laid them off temporarily. All people must decide when to be able to resume normal consumption and social patterns. Businesses must decide when to open, when to hire again, and when to start ordering supplies or make investment decisions. The expectations the economic actors have about timing of opening may not co-incide with bureaucratic decisions about “opening” the economy. Some evidence suggests that there is substantial disagreement about when the right time for opening back up may be (Pew Research Center, May 7, 2020).
Existing surveys on expectations in Canada and the US (Federal Reserve Bank of New York 2020; Armantier et al. 2017; Bank of Canada n.d.; Gosselin and Khan 2015) capture the change in business and consumer behavior only at monthly or quarterly frequencies. We set out to capture a small but critical indicator at much higher frequencies.
First results
We started fielding a survey, collecting Americans’ and Canadians’ expectations on the end of social distancing and business closures. Specifically, we asked the following two questions (see our methodology for additional details):
- How much longer do you expect social distancing rules (restrictions on gatherings, stay-at-home rules) to stay in place in your state/province?
- How much longer do you expect the closure of non-essential businesses to stay in place in your state/province?
Our collection started on Apr 24, 2020, and has repeated every Friday since then.1 Each week, we collect approximately 2,500 responses for each question in each country. As of May 08, 2020, we have received 20,548 responses. We plan to continue collecting this data and posting survey responses for the duration of the crisis.
Summary of Results
In both Canada and the US, respondents overwhelmingly expect business closures to end within the next three months. In the latest round, 68 % of respondents in the US expect business closures to end within 2 months. In Canada, the number of respondents expecting business to reopen is 59 %. Respondents generally expect social distancing measures such as bans on gatherings to stay in effect for longer. Very few respondent expect business closures to persist for more than 6 months, while non-sizeable fractions expect social distancing measures to last for that long. In Canada, expectations about the dates when social distancing measures and business closures end have remained fairly stable in the short time-frame at our disposal. This contrasts with the US, where respondents during May 2-8 expected social distancing measures to remain in place for much longer than they did during the prior week (April 25-May 1)
Responses
The following figures show the evolution of responses for each of the questions, in both countries.2
United States: Business closures
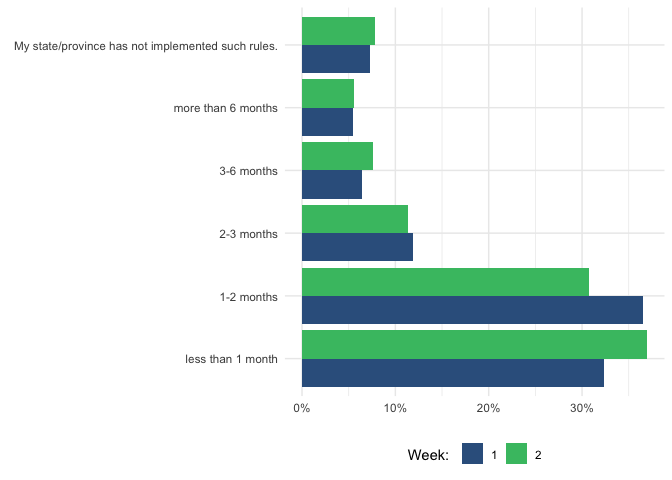
Weighted responses for US to the question: How much longer do you expect the closure of non-essential businesses to stay in place?
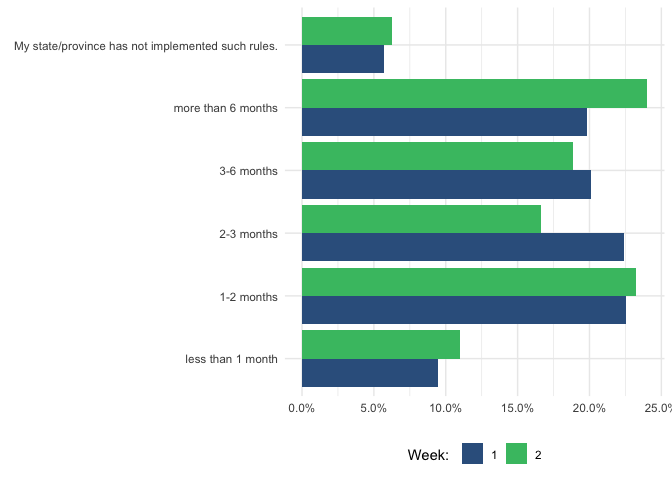
United States: Social Distancing
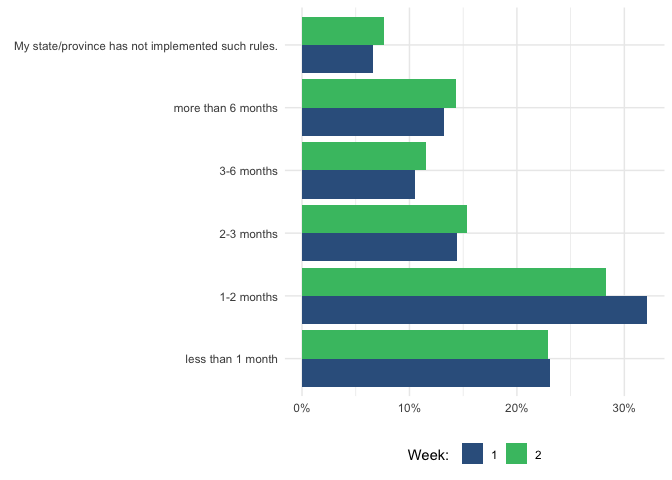
Weighted responses for US to the question: How much longer do you expect social distancing rules to stay in place?
Canada: Business closures
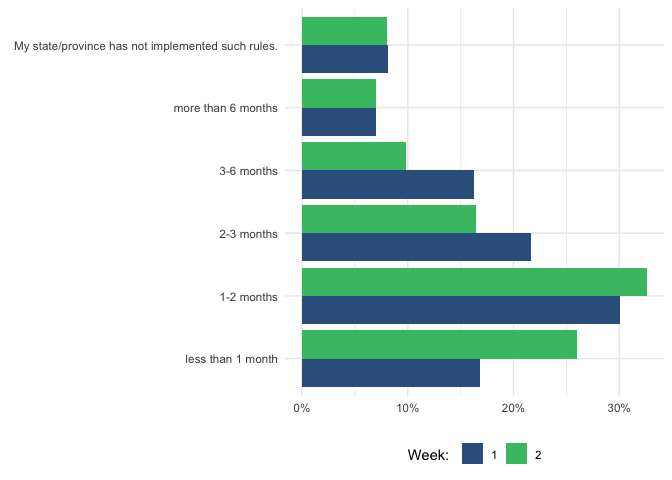
Weighted responses for Canada: How much longer do you expect the closure of non-essential businesses to stay in place?
Canada: Social Distancing
Weighted responses for Canada to the question: How much longer do you expect social distancing rules to stay in place?
Expectations
When do respondents expect the restrictions to be lifted? In the following, we show median responses on the five-point scale available for responding to our survey. We also show for each measure an estimated distribution of responses that fits the five-point distribution elicited from respondents.
Median response
| Country | Question type | Week 1 | Week 2 |
|---|---|---|---|
| CA | businesses | 2-3 months | 1-2 months |
| CA | people | 2-3 months | 2-3 months |
| US | businesses | 1-2 months | 1-2 months |
| US | people | 1-2 months | 1-2 months |
United States: Business closures

Estimated distribution and median of expectations of duration of business closures, US
United States: Social Distancing

Estimated distribution and median of expectations of duration of social distancing, US
Canada: Business closures

Estimated distribution and median of expectations of duration of business closures, Canada
Canada: Social Distancing

Estimated distribution and median of expectations of duration of social distancing, Canada
Data
Respondent data can be downloaded at https://labordynamicsinstitute.github.io/covid19-expectations-data/. The table below shows weighted responses.
Measures of uncertainty
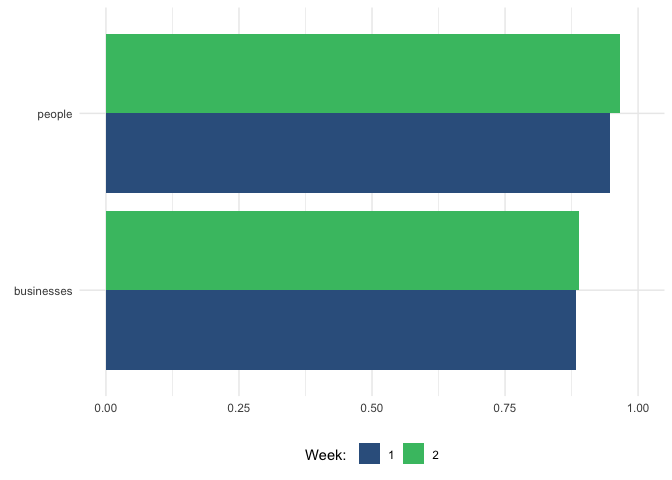
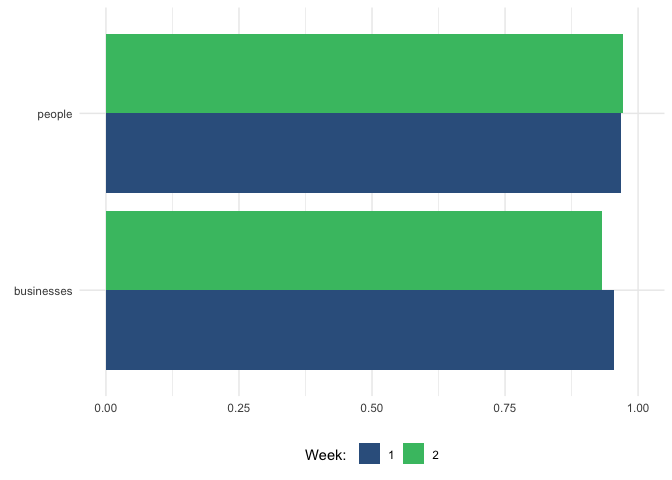
Dispersion of responses
We construct an index of dispersion such that it ranges between 0 and 1, with higher numbers indicating larger dispersion of responses (see Methodology for details)
US
Canada
Tables
| Question type | Country | Week 1 | Week 2 |
|---|---|---|---|
| businesses | CA | 0.953 | 0.941 |
| businesses | US | 0.87 | 0.885 |
| people | CA | 0.971 | 0.975 |
| people | US | 0.947 | 0.969 |
Next results
We also capture when recipients think that measures are not in effect in their state or province. This will become increasingly important.
Methodology
We briefly summarize the methodology here. For additional information, see our codebook.
Questions
We fielded two questions regarding uncertainty in the April 2020 COVID-19 situation in the US and Canada, with different questions for employment and consumer behavior:
- How much longer do you expect social distancing rules (restrictions on gatherings, stay-at-home rules) to stay in place in your state/province?
- How much longer do you expect the closure of non-essential businesses to stay in place in your state/province?
For each question, respondents could choose on a Likert scale with text: “less than 1 month”, “1-2 months”, “2-3 months”, “3-6 months”, “more than 6 months”, and a response equivalent to “does not apply” (“My state/province has not implemented such rules.”).
Data Collection
Data is collected using Google Surveys using an online non-probability survey. It uses stratified sampling for collection, based (in the US) on the target internet population from the 2017 Current Population Survey (CPS) Computer and Internet Use Supplement (Sostek and Slatkin 2018; Google 2020).
Weighting
Weights are provided by Google Surveys, based on the imputed demographics. For the US, the US Census Bureau’s Current Population Survey (CPS) Computer and Internet Use Supplement is used (currently the 2017 version). For Canada, Google (2020) points to a “combination of government data and internal Google data sources.” Google uses post-stratification weighting to align the weighted demographics with the target population. ### Estimates
To compute the smooth distribution of expectations, we use minimum distance to estimate the four parameters of an equal-weighted mixture of two log-normal distributions.
Measures
Our index of dispersion is computed as follows. We compute the Simpson or Herfindahl index \(HHI\) of the dispersion across various responses. The index is computed as the sum of squared proportions: \(HHI = \sum_{k=1}^K p_k^2\), where \(p_k\) are the fractions corresponding to each response to the question. If all respondents had provided the same answer, i.e., no uncertainty in the population, \(HHI_{max}\) = 1. Maximum uncertainty is present when there is an even distribution across answer choices, with \(HHI_{min}\) = 0.2.3 We normalize the index subtracting it from 1, and dividing by its range, so that \(HHI_{norm} = \frac{1 - HHI}{range(HHI)} \in [0,1]\), with 1 being maximum dispersion.
References
Armantier, Olivier, Giorgio Topa, Wilbert van der Klaauw, and Basit Zafar. 2017. “An Overview of the Survey of Consumer Expectations.” Economic Policy Review 23 (2): 51–72. https://www.newyorkfed.org/medialibrary/media/research/epr/2017/epr_2017_survey-consumer-expectations_armantier.pdf.
Bank of Canada. n.d. “Canadian Survey of Consumer Expectations.” Accessed April 15, 2020. https://www.bankofcanada.ca/publications/canadian-survey-of-consumer-expectations/.
Federal Reserve Bank of New York. 2020. “Survey of Consumer Expectations.” https://www.newyorkfed.org/microeconomics/sce.
Google. 2020. “Methodology Google Surveys.” https://support.google.com/surveys/answer/6189786.
Gosselin, Marc-André, and Mikael Khan. 2015. “A Survey of Consumer Expectations for Canada.” Bank of Canada Review Autumn: 14–23. https://www.bankofcanada.ca/wp-content/uploads/2015/11/boc-review-autumn15-gosselin.pdf.
Sostek, Katrina, and Brett Slatkin. 2018. “How Google Surveys Works.” Whitepaper. Google. https://services.google.com/fh/files/misc/white_paper_how_google_surveys_works.pdf.
Respondent data can be downloaded at https://labordynamicsinstitute.github.io/covid19-expectations-data/.↩
Responses are weighted. See section on weighting for details.↩
We could also assume an even distribution of answers across time, and weight the responses by the width of the interval implicit in each response choice.↩